


User Guide to Progress Reports
Students’ vs Time Report
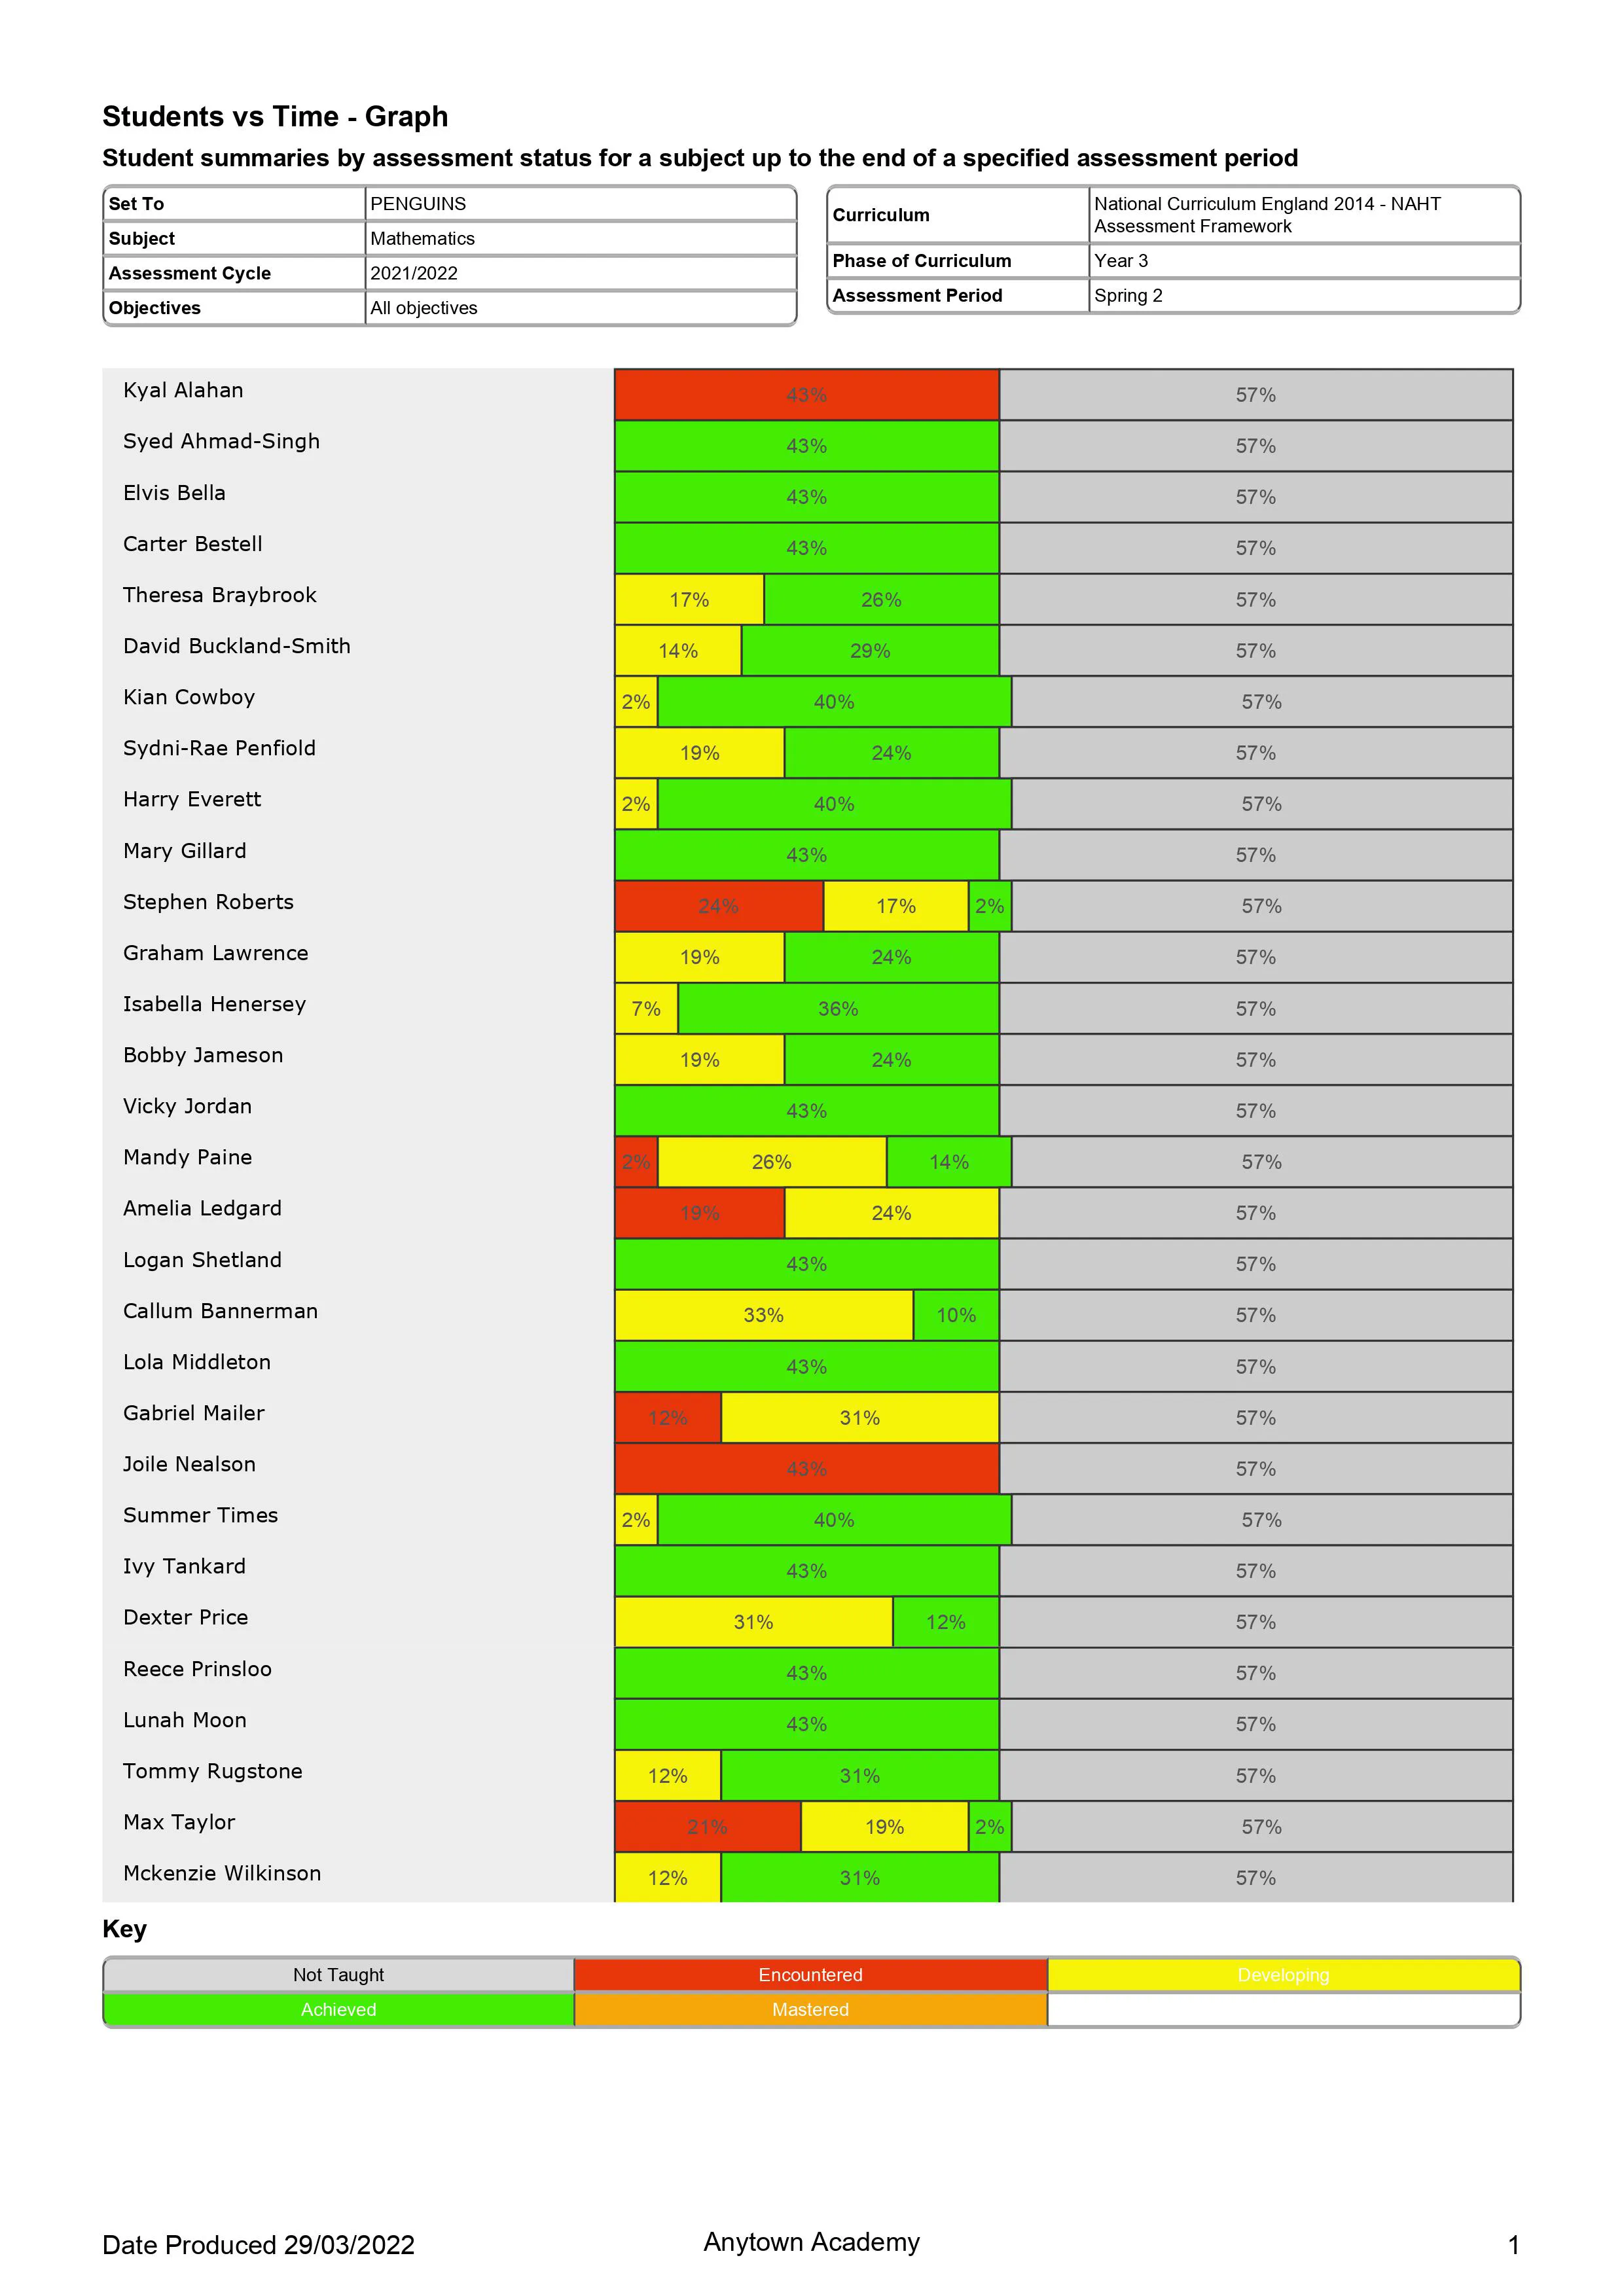
Initially the first report a teacher may wish to generate especially if it’s coming up to a progress review point or a parent consultation evening would be: Students vs Time report. This gives you a clearer overview of how the children in a cohort are progressing (percentage of assessment statuses) in relation to curriculum coverage at that given time. Clearly showing everyone’s progress in the subject.
This report can be found in the Progress Coverage Summary section of the Reporting application
The Parameters defined were:
- Seelect Curriculum
- Select Reporting Period (Cycle and Period)
- Filter by KPI's or All Objectives
Functionality:
- Viewed on Frog count as well as %
View Frog Progress & Graphic: Progress Coverage Summary – Students vs Time - Graph
View Frog Progress & Graphic: Progress Coverage Summary – Students vs Time - Table
- The name and description of the report can be changed.
- The report can be saved in the My Reports section of the Application for use later
- The report can be downloaded as a pdf to be shared